Figure 1: Network of countries, linked based on ownership between its firms. Node color is proportional to the country's sink-OFC value. Node size is proportional to the country's conduit-OFC value.

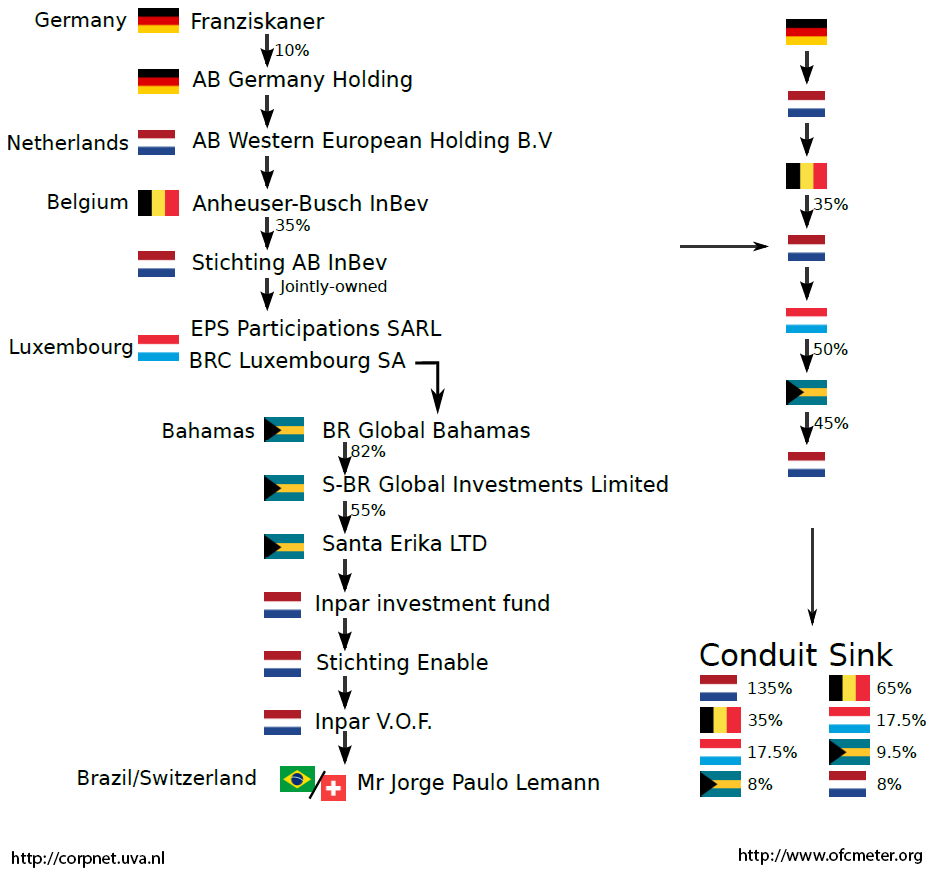
Figure 2: Example of a global corporate ownership chain (left), a country chain (top right) and sink/conduit scores (bottom right). Example may not reflect current corporate structure.
The current research presents results based on one snapshot of the global ownership network. We plan to re-compute the list of OFCs on a yearly basis.
What is an OFC?
 An Offshore Financial Center (OFC) is a jurisdiction (often a country) that provides corporate
and financial services to non-resident companies on a scale that is incommensurate with the size of its economy.
Traditionally, OFCs are assumed to be small, low-tax jurisdictions in remote locations.
In practice, determining which countries are in fact OFCs is nontrivial and as such a highly debated topic.
Our research
Without making any a priori assumptions about jurisdictions possibly involved, we employ a data-driven method based on network analysis to identify OFCs. Our data covers over 77 million ownership relations, which together form a large network in which value flows from subsidiaries to shareholders. From it we extract millions of global corporate ownership chains (see Figure 2). The resulting fine-grained insight allows us to not only see where value originates and ends up, but also exactly where it originated. This allows us to identify two types of OFCs:
- Sink-OFC: a jurisdiction in which a disproportional amount of value disappears from the economic system.
- Conduit-OFC: a jurisdiction through which a disproportional amount of value moves toward sink-OFCs.
Our results
Figure 1 visualizes the results in a country-level network. The resulting ranking of in total 24 sink and 5 conduit OFCs is as follows:
Sinks (24)
| VG | British Virgin Islands | 5235 | MH | Marshall Islands | 100 | BZ | Belize | 38 |
| TW | Taiwan | 2278 | MT | Malta | 100 | GI | Gibraltar | 34 |
| JE | Jersey | 397 | MU | Mauritius | 75 | AI | Anguilla | 27 |
| BM | Bermuda | 374 | LU | Luxembourg | 71 | LR | Liberia | 17 |
| KY | Cayman Islands | 331 | NR | Nauru | 67 | VC | St. Vincent & Grenadines | 14 |
| WS | Samoa | 277 | CY | Cyprus | 62 | GY | Guyana | 14 |
| LI | Liechtenstein | 225 | SC | Seychelles | 60 | HK | Hong Kong | 14 |
| CW | Curacao | 115 | BS | Bahamas | 40 | MC | Monaco | 11 |
The sink-OFC number indicates roughly how much more value sinks in this country as compared to what should sink in it based on the size of its economy. For example, in the British Virgin Islands, over 5000 times too much value ends.
Conduits (5)
| Country | Value out | Value in | Factor out | Factor in | |
| NL | Netherlands | 740 billion | 380 billion | 18.6 | 22.5 |
| GB | United Kingdom | 380 billion | 130 billion | 3.1 | 2.4 |
| CH | Switzerland | 220 billion | 27 billion | 6.9 | 2.0 |
| SG | Singapore | 72 billion | 22 billion | 5.1 | 3.8 |
| IE | Ireland | 64 billion | 33 billion | 5.9 | 7.2 |
The conduit-OFC number indicates roughly how much more value is channeled in and out of this country towards a sink, as compared to what should based on its economy's size. For example, roughly 20 times more value is routed through the Netherlands.
Reference
More information on offshore financial centers, our approach, data and these results can be found in our paper:
![]() J. Garcia-Bernardo, J. Fichtner, F.W. Takes and E.M. Heemskerk, Uncovering Offshore Financial Centers: Conduits and Sinks in the Global Corporate Ownership Network,
Scientific Reports 7, article 6246, 2017.
J. Garcia-Bernardo, J. Fichtner, F.W. Takes and E.M. Heemskerk, Uncovering Offshore Financial Centers: Conduits and Sinks in the Global Corporate Ownership Network,
Scientific Reports 7, article 6246, 2017.
doi: 10.1038/s41598-017-06322-9
About CORPNET
The CORPNET research group uncovers, investigates and aims to understand global networks of corporate control. The group, housed at the University of Amsterdam, employs a multidisciplinary approach to understanding the global corporate system using methods from the field of network science. The five year project started in September 2015 and is funded by the European Research Council (grant agreement #638946).
About the authors
Website created in 2017 by the CORPNET group at the University of Amsterdam. Want to know more? Contact us!


